What Is Web Analytics, and Why Should You Care?
Web analytics is the practice of turning raw hits into a decision you can defend. Here is what it measures, where the numbers come from, and which ones deserve your attention in the first month.
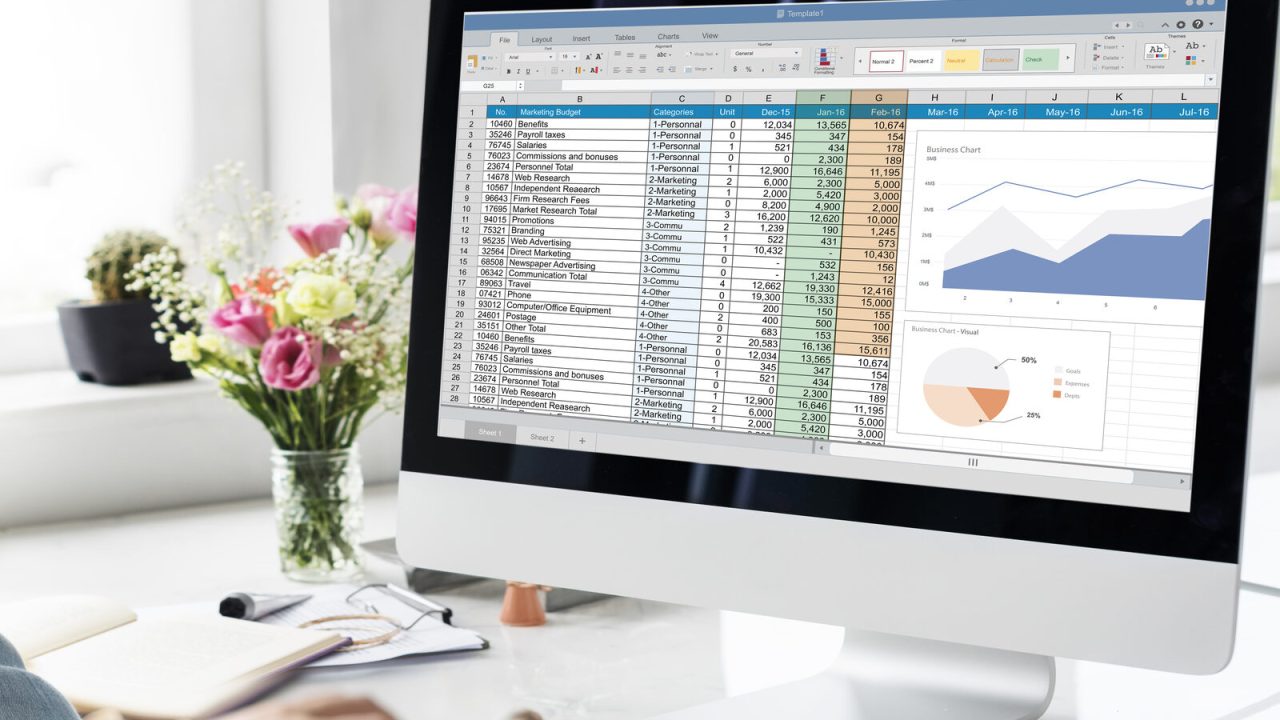
Web analytics is the practice of collecting what visitors do on a site, turning those raw events into countable units, and reading the result closely enough to change something. The collecting part is nearly free. The reading part is where the work is.
Most explanations stop at “measuring website traffic”, which is true and useless. Traffic is not one number. It is a pile of requests that a tool has grouped into sessions, attributed to sources, and filtered for bots — and every one of those decisions changes what you see.
What gets measured
Three layers sit between a visitor and a chart.
Collection. A snippet of JavaScript fires when a page loads, or a server writes a line to a log, or a tag manager sends a request to an endpoint you control. Each of those produces an event: a page view, a click, a form submit, a purchase.
Processing. The tool groups events into sessions, ties sessions to a visitor identifier, decides which visits came from the same person, and drops what looks like automated traffic. This is where identical raw data turns into different reports in different products.
Reporting. The interface aggregates those units by date, page, source and device, and applies whatever definitions the vendor chose for “engaged”, “bounce” and “conversion”.
You are always reading the third layer. When a number looks wrong, the cause is usually in the second.
Where the data comes from
There are three practical collection methods, and they answer slightly different questions.
| Method | Sees | Misses | Suits |
|---|---|---|---|
| Client-side JavaScript | Clicks, scrolls, form interaction, screen size, referrer | Visitors with blockers, users who leave before the script runs, non-JS clients | Product and marketing questions |
| Server logs | Every request, including bots, feeds, images and API calls | Anything that happens in the browser after the page is delivered | Infrastructure, crawl behaviour, uptime forensics |
| Server-side tagging | Whatever your endpoint chooses to record and forward | What you did not instrument; adds hosting cost and latency | Sites with strict privacy or ad-blocking pressure |
A site running client-side analytics alone will report fewer visits than its access log shows. That gap is normal — the log is counting crawlers and asset requests, the script is counting people whose browsers executed it.
Why two tools never agree
Run two analytics products side by side for a week and you will get two different traffic numbers, sometimes 20–40% apart. The usual causes, in order of how often they explain the gap:
- Session definition. Most tools close a session after 30 minutes of inactivity, but some restart it at midnight, some restart it when the campaign source changes, and some do both.
- Bot filtering. Vendors maintain their own lists. One product’s “visit” is another’s discarded crawler.
- Consent gating. If the script only loads after a banner is accepted, everything before the click is invisible. Two tools with different consent categories will see different fractions of the same audience.
- Tag placement. A snippet in the footer misses visitors who leave during load. One in the head does not.
- Sampling. On large properties, some interfaces estimate from a subset once a report crosses a threshold, and say so quietly.
None of this makes the numbers useless. It makes cross-tool comparison useless. Pick one source for each question and stay with it.
The reports worth reading first
A new property offers dozens of screens. Four of them earn their place in the first month.
Landing pages with sessions and conversion rate. This is the only view that ties an entry point to an outcome. Sorting by sessions shows what search and social send you; sorting by conversion rate shows which of those pages does anything with the visit.
Source and medium. Not for a vanity split between channels, but to catch mislabelled traffic — paid clicks landing in “organic”, email showing as “direct”, a partner site tagged as referral when it should be campaign-tracked.
Engaged sessions per user. A single visit tells you a page was found. Repeat visits tell you it was worth finding.
Search queries, from Search Console rather than the analytics tool. Analytics shows what happened after the click. Search Console shows the impressions that never turned into one, which is where most of the opportunity sits.
Numbers that mislead beginners
Bounce rate. In older tools it meant “one page view and nothing else”. In GA4 it is the inverse of engagement rate, so a visitor who reads for eleven seconds and leaves is engaged, while a two-second look at the same page is not. A “bounce” on a contact page and on a blog post mean opposite things.
Direct traffic. Rarely someone typing your domain. It collects app referrals stripped of headers, links in PDFs and desktop email clients, HTTPS-to-HTTP transitions, and anything a browser refused to attribute. Growth in direct usually means a tagging leak, not brand fame.
Average position. An average across every query a page ranks for, weighted by impressions. A page that ranks first for a phrase nobody searches and fortieth for the one that matters will report a flattering middle.
Time on page. Traditionally calculated from the gap between two page views, which means the last page in a visit has no measurable duration at all. This is the measurable shadow of dwell time. Products that fire engagement pings solve it; those that do not report a number that quietly excludes exits.
How long before the data means anything
Give it four to six weeks before drawing conclusions, longer for sites under a few hundred sessions a week. A single week contains one of each weekday, a payday, and possibly a newsletter — you cannot separate the effect of your change from the shape of the calendar.
Two rules keep early analysis honest. Compare like periods: four full weeks against the previous four, not “this month so far” against a complete one. And write down what you expected before you look, because a report will always support a story if you go in looking for one.
What it costs
Free tiers cover most small sites. Google Analytics 4 is free at ordinary volumes; open-source options such as Matomo or Umami can be self-hosted for the price of a small server; privacy-focused hosted products start in the low tens per month and price by page views rather than seats.
The real cost is not the licence. It is the hour a week someone spends reading the reports, and the discipline to instrument events properly before you need them. A tracking plan written on one page — event names, when they fire, what parameters they carry — saves more money than any pricing decision.
Why it matters for a small site
On a site with 500 visits a month, analytics will not find a statistically clean uplift from a button colour. It will do something more useful: show you the three pages that get found, the one that converts, and the twenty that nobody has ever read. That alone redirects a year of writing.
The point is not the dashboard. It is having a defensible answer when someone asks why you changed the homepage, and being able to tell the difference between a good week and a good decision.
Ethan Lewis
Ethan Lewis has spent a decade wiring analytics into sites that were never built for it — e-commerce carts, membership portals, marketing sites with three tag managers. He writes Statlyzer to keep the answers in one place.
Keep reading
-
Web Analytics
Google Analytics 4: The Complete Guide
6 min read
-
Web Analytics
GDPR for Web Analytics and Marketing: A Compliance Guide
6 min read
-
Web Analytics
Understanding Dwell Time: Why It Matters Even to Small Blogs
5 min read