Google Analytics 4 isn’t just an update — it’s a fundamentally different way to track and understand your website traffic. If you’ve been putting off learning GA4, or if your current setup feels like it’s collecting data without actually telling you anything useful, this guide is for you.
I’ve spent months working with GA4 across dozens of sites, from small blogs to e-commerce stores. In this guide, I’ll walk you through everything from initial setup to advanced analysis — with actual interface screenshots and the practical tips I wish someone had told me when I started.
What you’ll learn:
- How to create and configure a GA4 property from scratch
- The event-based data model and why it changes everything
- How to track conversions (now called Key Events) that matter to your business
- How to build custom reports and explorations
- Common mistakes that silently corrupt your data
Table of Contents
1. What Is Google Analytics 4?
Google Analytics 4 (GA4) is Google’s current analytics platform, and the only version available since July 2023 when Universal Analytics (UA) was officially retired. But GA4 isn’t just “Universal Analytics with a new coat of paint” — it’s built on an entirely different architecture.
The Shift from Sessions to Events
Universal Analytics organized everything around sessions — a user visits your site, views some pages, maybe clicks a button, and leaves. That’s one session with several “hits” inside it.
GA4 flips this model. Instead of sessions, everything is an event. A page view? That’s an event. A scroll? Event. A purchase? Also an event. Even the session itself is tracked as a session_start event.
This sounds like a subtle difference, but it changes how you think about analytics entirely:
- In UA: “How many sessions resulted in a purchase?” (session-centric)
- In GA4: “What sequence of events led users to purchase?” (user-centric)
The event-based model is more flexible. You can track virtually any interaction — video plays, file downloads, form submissions, scroll depth — without the rigid hit-type categories that UA imposed.
💡 Why this matters: If you’re coming from UA, stop thinking in sessions. GA4 rewards you for thinking about user journeys — sequences of events across multiple sessions, devices, and days.
Key Differences at a Glance
| Feature | Universal Analytics | Google Analytics 4 |
|---|---|---|
| Data model | Session-based (hits) | Event-based |
| User tracking | Client ID only | Cross-platform (User ID + Google Signals) |
| Conversions | Goals (max 20 per view) | Key Events (up to 30) |
| Bounce rate | % single-page sessions | Inverse of engagement rate |
| Reporting | 100+ pre-built reports | Simplified reports + Explorations |
| Data retention | Indefinite | 2 or 14 months (free tier) |
| BigQuery export | 360 only (paid) | Free for all users |
| Privacy | Limited controls | Consent Mode, IP anonymization by default |
Who Needs GA4?
Short answer: everyone with a website. GA4 is now the only Google Analytics option available. Whether you’re running a personal blog, an e-commerce store, or a SaaS product — if you use Google Analytics, you’re using GA4.
The good news: despite its rocky launch and initial confusion, GA4 has matured significantly. Most of the features people missed from UA have been added back (including the beloved landing page report), and the new Explorations feature is genuinely powerful.
2. Setting Up GA4 from Scratch
Setting up GA4 takes about 15 minutes if you know where to click. Here’s the step-by-step process.
Step 1: Create a Google Analytics Account
If you don’t already have a Google Analytics account, go to analytics.google.com and sign in with your Google account. Click “Start measuring” to create your first account.
Enter your account name (usually your business name), configure data sharing settings (the defaults are fine for most sites), and click Next.
Step 2: Create a GA4 Property
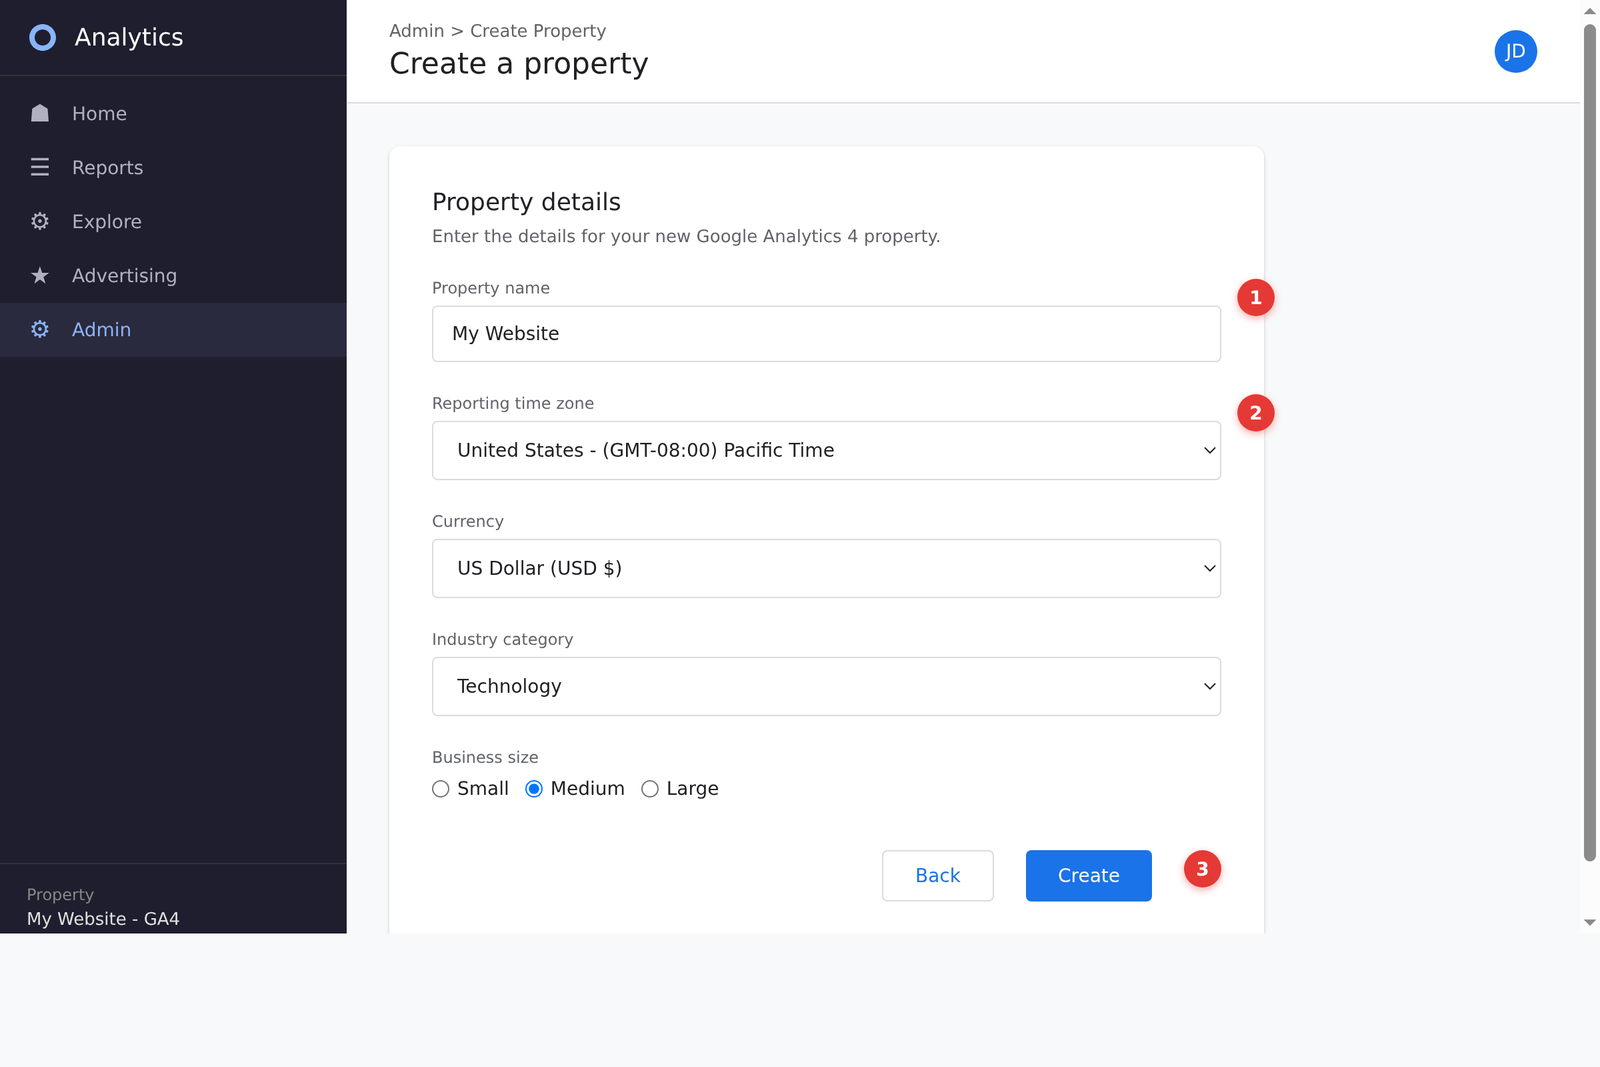
The property is where your data lives. Fill in these fields:
- Property name: Use something descriptive like “My Website – Production”. If you plan to have separate properties for staging/development, make this clear in the name.
- Reporting time zone: Choose the time zone where your business operates. This affects how daily data boundaries are calculated — if you pick US Eastern, your “today” starts at midnight ET.
- Currency: Select your primary business currency. This is used for revenue reporting.
Click Next, answer a few questions about your business (industry, size), and then click Create.
⚠️ Common Mistake: Don’t create separate properties for each subdomain (blog.example.com and shop.example.com). Use a single property with multiple data streams instead. Separate properties fragment your user data and make cross-domain analysis impossible.
Step 3: Set Up a Data Stream
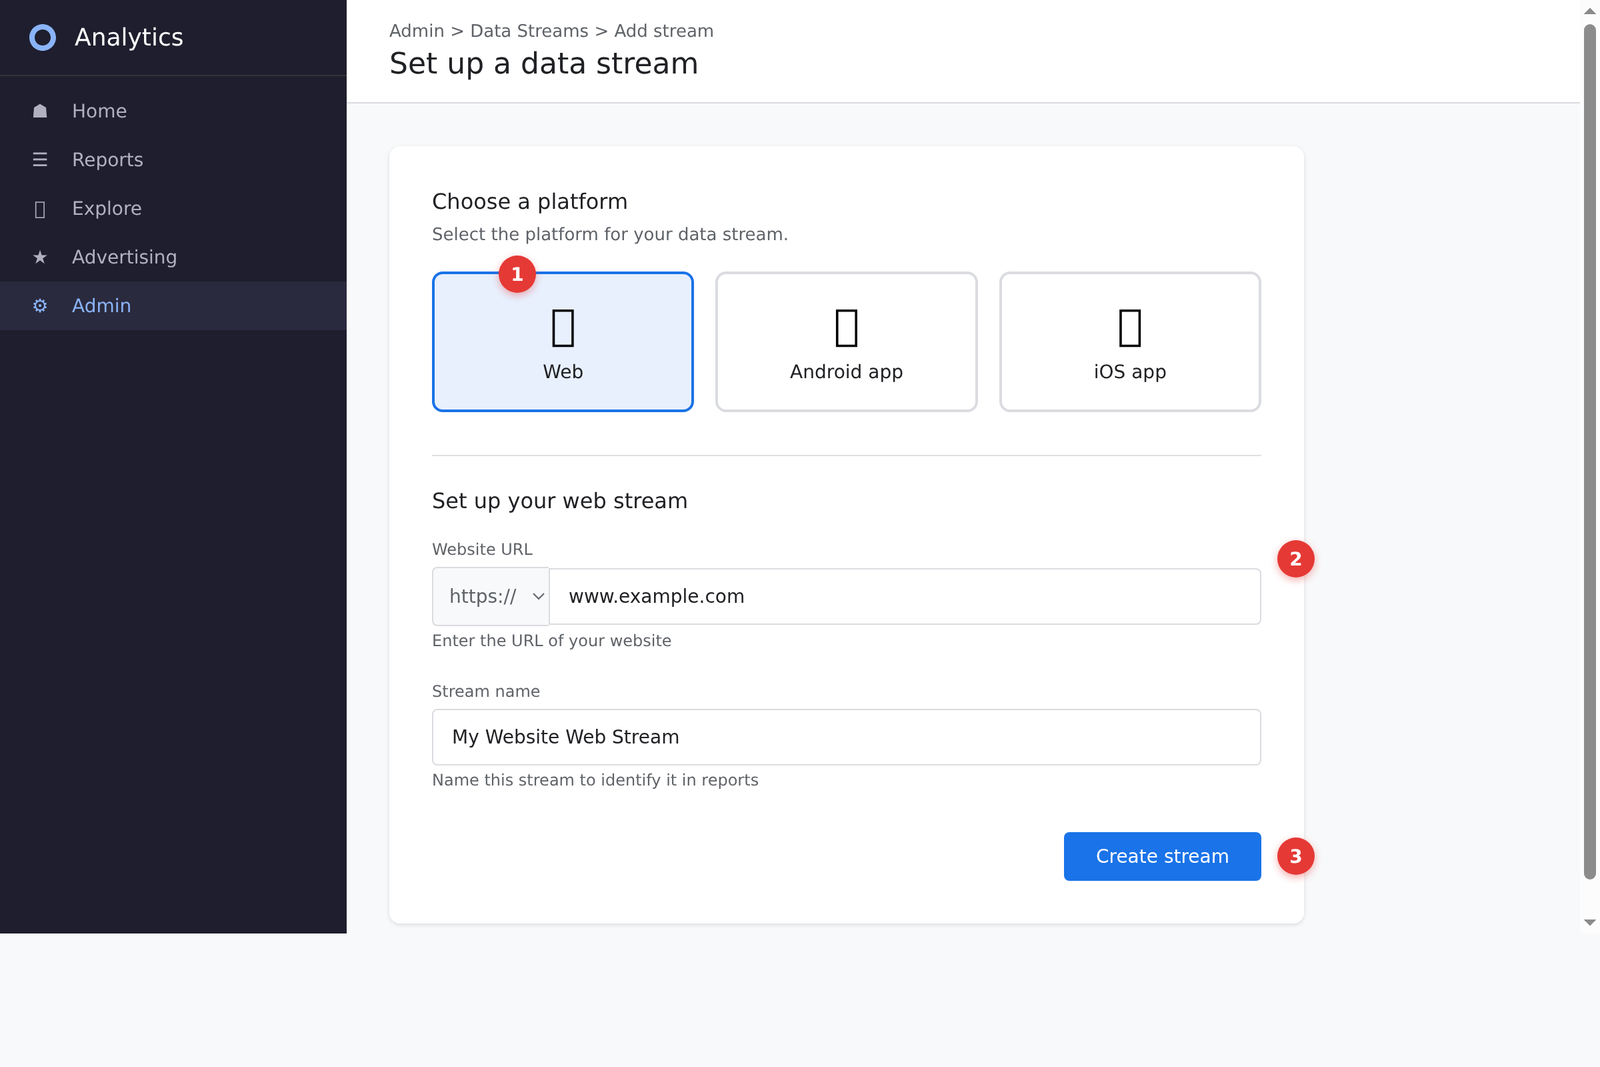
A data stream is the connection between your website (or app) and GA4. For a website, you’ll create a Web data stream.
- Select Web as your platform
- Enter your website URL (e.g.,
https://example.com) - Give the stream a name (e.g., “Main Website”)
- Click Create stream
After creation, you’ll see your Measurement ID — it looks like G-XXXXXXXXXX. This is the ID you’ll need for the next step.
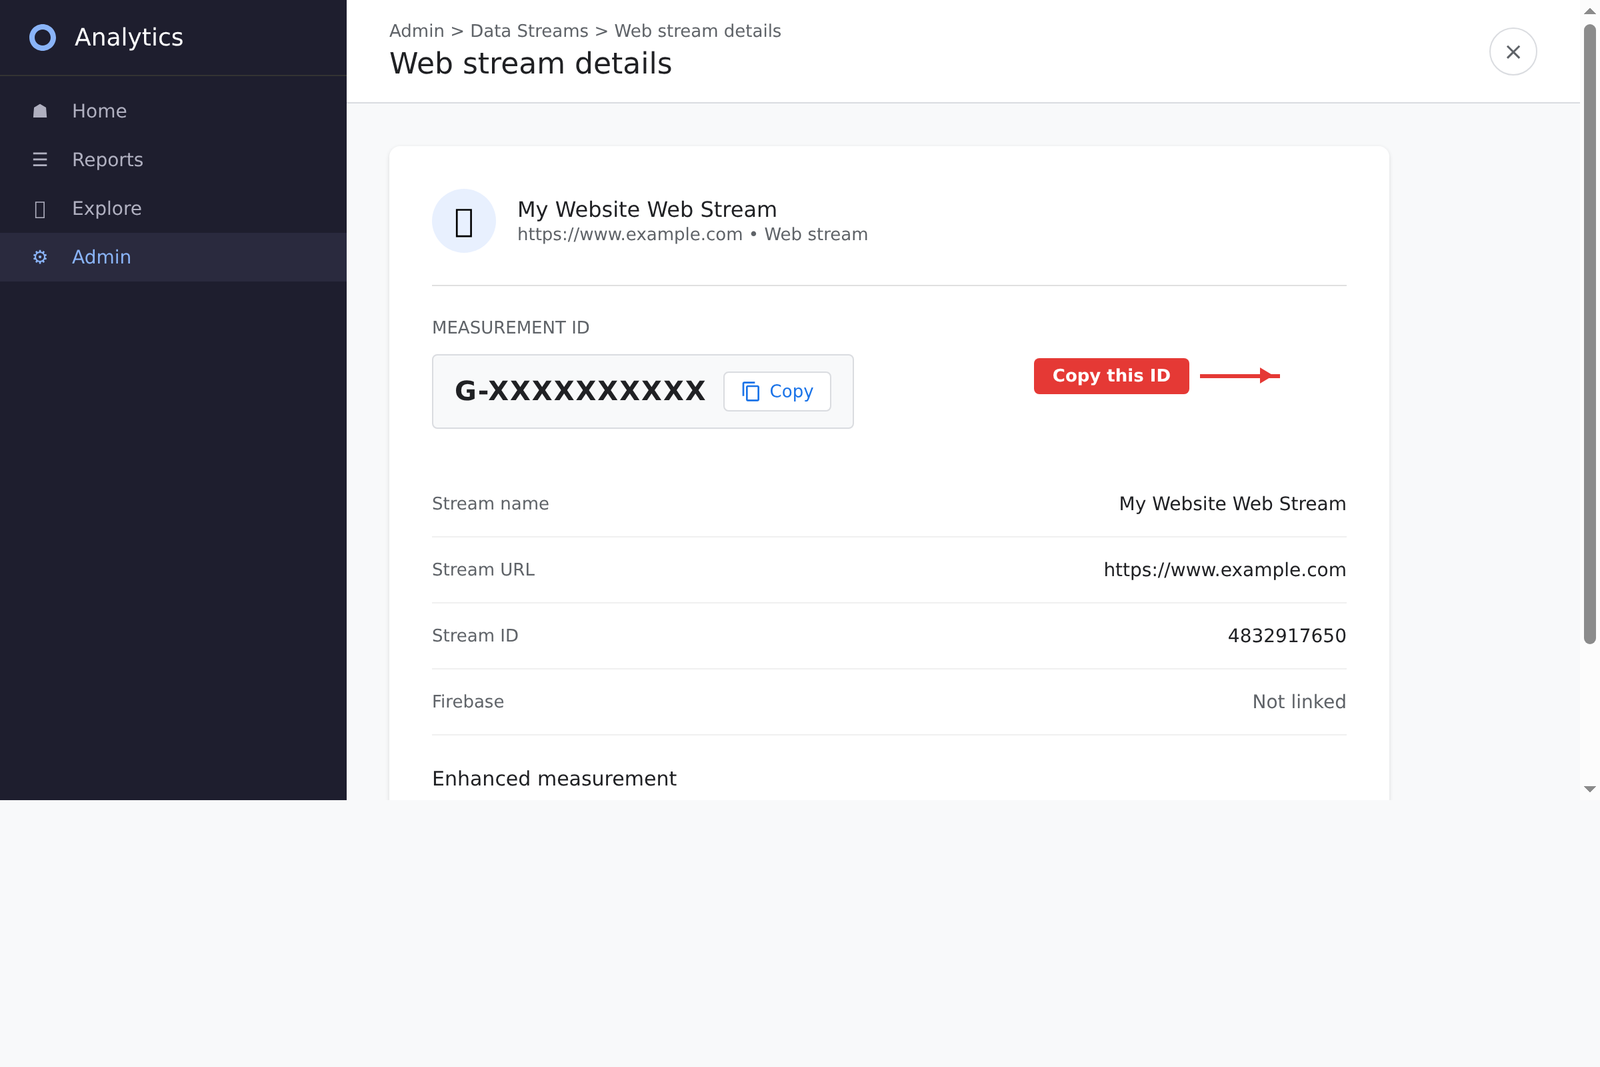
Enhanced Measurement: Free Tracking Without Code
Before leaving this screen, check the Enhanced measurement toggle — it should be ON by default. This automatically tracks:
- Page views (including virtual page views in single-page apps)
- Scrolls (fires when user reaches 90% of page depth)
- Outbound clicks (clicks to external domains)
- Site search (when users use your site’s search)
- Video engagement (play, progress, completion for embedded YouTube videos)
- File downloads (PDFs, docs, spreadsheets, etc.)
This is one of GA4’s best features — you get meaningful interaction data without writing a single line of code.
Step 4: Install the Tracking Code
You have three main options for installing GA4 on your site:
Option A: Google Tag (gtag.js) — Direct Installation
The simplest method. Copy the code snippet from your data stream settings and paste it into the <head> section of every page:
<!-- Google tag (gtag.js) -->
<script async src="https://www.googletagmanager.com/gtag/js?id=G-XXXXXXXXXX"></script>
<script>
  window.dataLayer = window.dataLayer || [];
  function gtag(){dataLayer.push(arguments);}
  gtag('js', new Date());
  gtag('config', 'G-XXXXXXXXXX');
</script>
Replace G-XXXXXXXXXX with your actual Measurement ID.
Option B: Google Tag Manager (GTM) — Recommended
If you plan to track custom events (and you should), GTM gives you much more flexibility. Here’s how:
- Go to tagmanager.google.com and create a container for your site
- Install the GTM container snippet on your website
- In GTM, create a new tag: Google Analytics: GA4 Configuration
- Enter your Measurement ID
- Set the trigger to All Pages
- Publish the container
GTM is the method I recommend for most sites. It lets you add, modify, and debug event tracking without touching your website’s code — and you can preview changes before they go live.
Option C: WordPress Plugin
If you’re on WordPress, you can use a plugin like Site Kit by Google or add the Measurement ID directly through your SEO plugin (Yoast, Rank Math, etc.). Most modern WordPress SEO plugins have a built-in field for the GA4 Measurement ID — just paste it in and save.
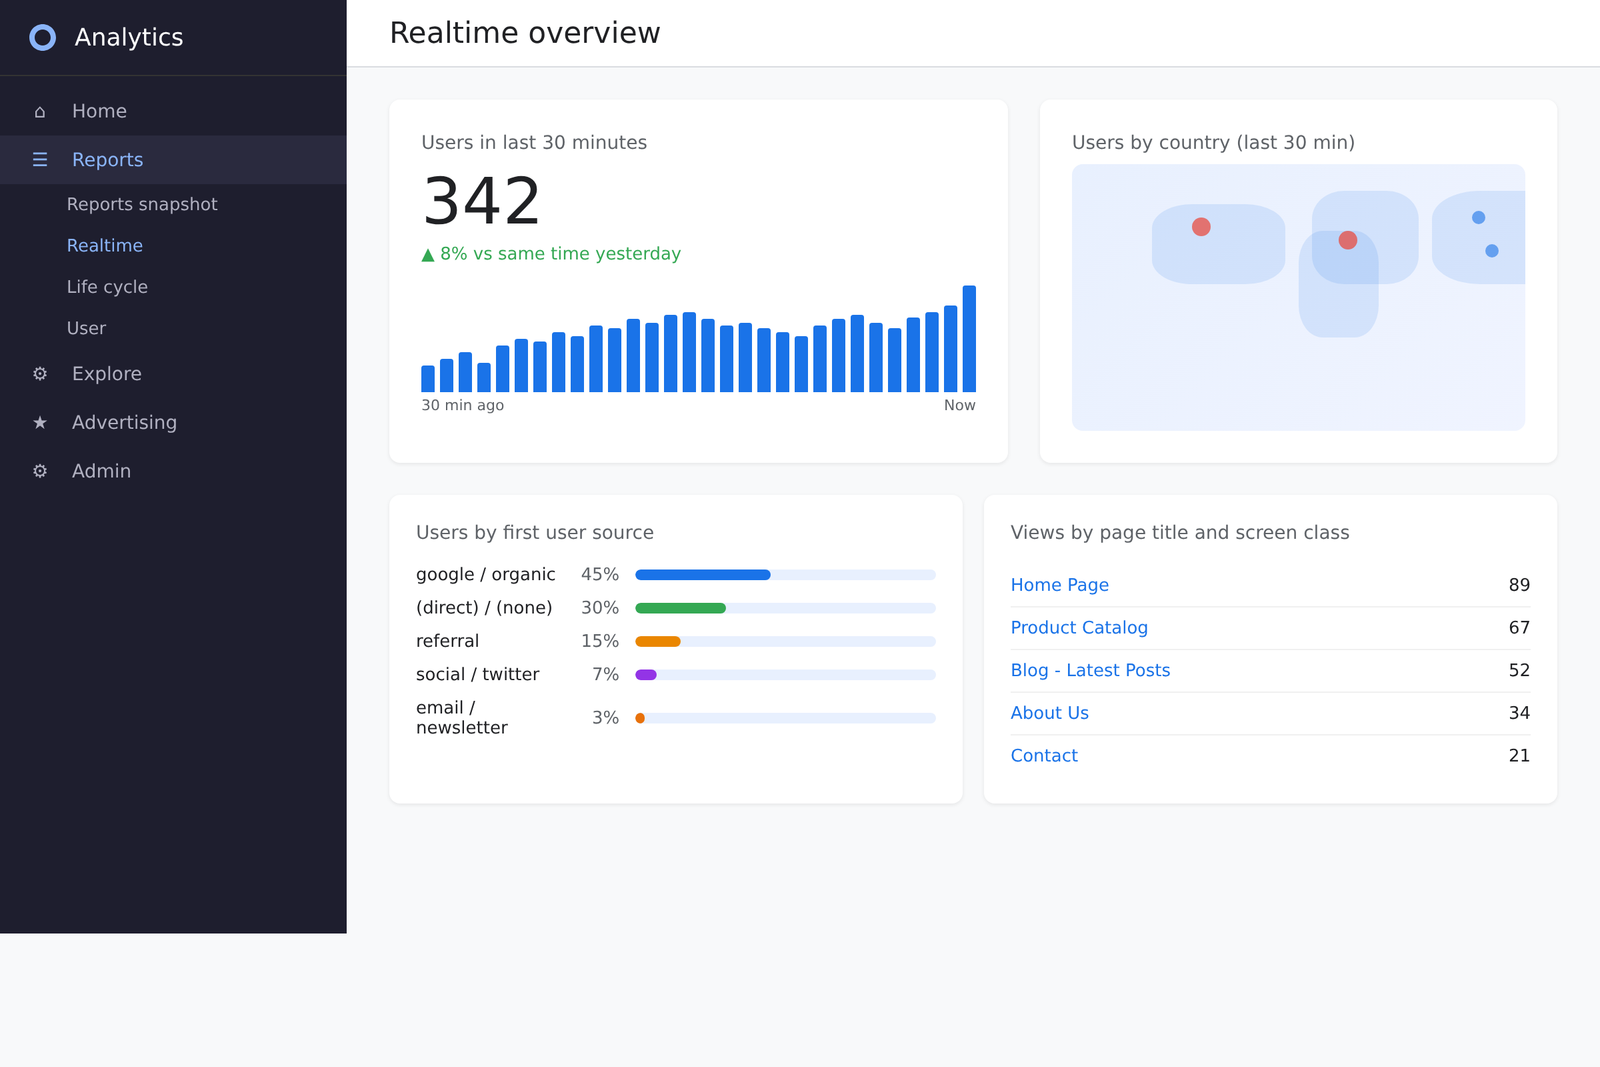
Step 5: Verify Data Is Flowing
After installation, go to your GA4 property and click Reports → Realtime. Open your website in another browser tab and navigate around. Within 30 seconds, you should see your activity appear in the real-time report.
If you don’t see any data after a few minutes:
- Check that the Measurement ID is correct
- Verify the tracking code is in the
<head>section (not the<body>) - Disable any ad blockers on your browser
- Check if a consent management platform is blocking the tag before consent is given
💡 Pro Tip: Install the Google Analytics Debugger Chrome extension. It outputs GA4 events to your browser console in real time, making it much easier to verify that events are firing correctly.
3. Understanding the GA4 Interface
The GA4 interface can feel overwhelming at first, especially if you’re used to UA’s 80+ pre-built reports. GA4 takes a different approach: fewer standard reports, but much more powerful custom analysis tools.
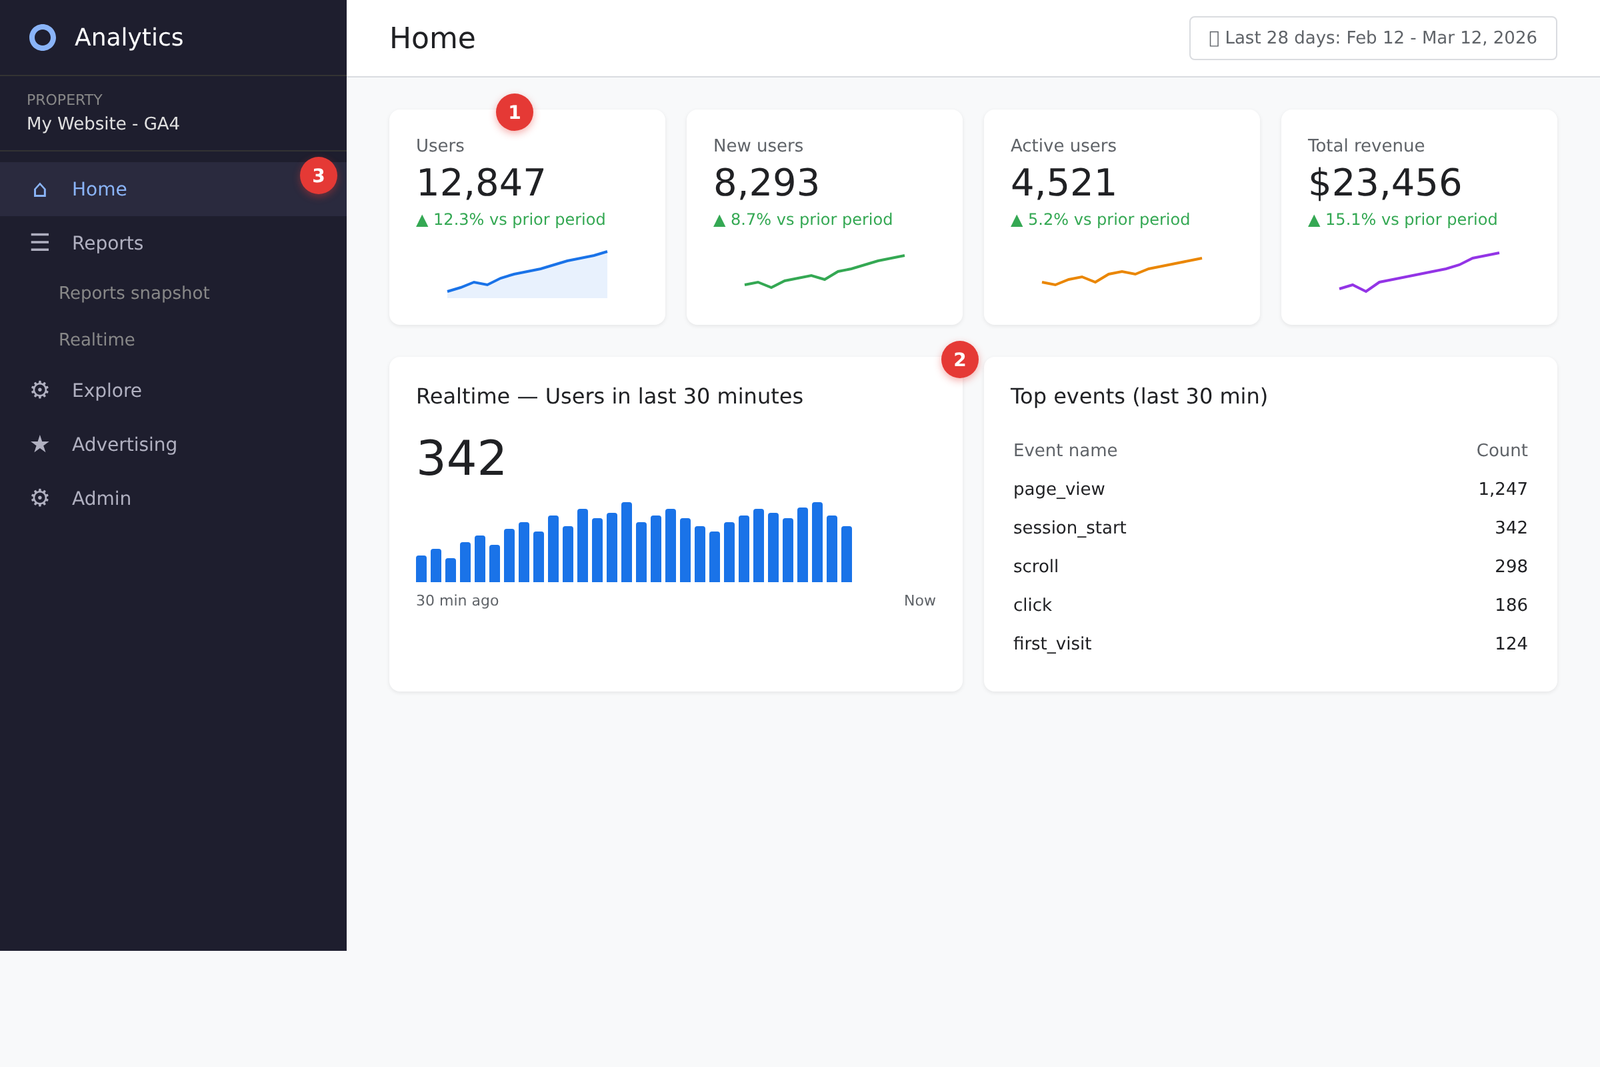
The Home Dashboard
When you log in, the Home screen gives you a quick snapshot:
- Overview cards: Users, new users, active users, and average engagement time for the last 7 days (or 28 days — you can toggle)
- Recently accessed: Quick links to reports you’ve viewed recently
- Suggested reports: GA4’s AI surfaces insights it thinks are relevant based on your data patterns
- Real-time card: A miniature view of current active users
Left Sidebar Navigation
The left sidebar is your main navigation. Here’s what each section does:
| Section | What it does | When to use it |
|---|---|---|
| Home | Overview dashboard | Quick daily check-in |
| Reports | Pre-built standard reports | Regular reporting, traffic sources, pages |
| Explore | Custom analysis (Explorations) | Deep analysis, funnels, user paths |
| Advertising | Attribution and conversion paths | Analyzing marketing channel performance |
| Admin | Settings and configuration | Setup, data streams, integrations |
Key Metrics You’ll See Everywhere
GA4 introduces several new metrics. Here are the ones you’ll encounter most:
- Active Users: The primary user metric in GA4 (replaces “Users” from UA). Counts users who had an engaged session or triggered a key event.
- Engaged Sessions: Sessions that lasted longer than 10 seconds, had a key event, or had 2+ page views. This is GA4’s way of filtering out bounces.
- Engagement Rate: Percentage of sessions that were “engaged.” If your engagement rate is 55%, that means 55% of sessions met the engaged session criteria. (Bounce rate = 100% – engagement rate)
- Average Engagement Time: How long users actively interacted with your page (tab in foreground, page visible). More accurate than UA’s “time on page,” which counted time between hits.
- Event Count: Total number of times a specific event occurred.
💡 Pro Tip: Engagement rate is often more useful than bounce rate. A “bounce” in UA meant the user viewed one page. In GA4, a session only counts as not engaged if the user spent less than 10 seconds, viewed only one page, AND didn’t trigger any key events. This gives you a more realistic picture of whether visitors are actually finding your content useful.
4. Events: The Foundation of GA4
Understanding events is the single most important thing you can do in GA4. Every piece of data — from a simple page view to a complex e-commerce transaction — is an event.
The Four Types of Events
GA4 organizes events into four categories. Knowing which category your tracking needs fall into will save you significant time:
1. Automatically Collected Events
These fire automatically as soon as the GA4 tracking code is installed. You don’t need to configure anything:
first_visit— User’s first visit to your sitesession_start— A new session beginsuser_engagement— User is actively engaged with the pagepage_view— A page is loaded (via Enhanced Measurement)
2. Enhanced Measurement Events
Tracked automatically when Enhanced Measurement is enabled (it’s on by default). These capture common interactions without any code:
scroll— User scrolls past 90% of the pageclick— User clicks an outbound linkview_search_results— User performs a site searchvideo_start,video_progress,video_complete— YouTube video interactionsfile_download— User downloads a file
3. Recommended Events
Google provides a list of recommended event names for common scenarios. You need to implement these yourself, but using Google’s naming convention means GA4 can provide pre-built reports for them:
- E-commerce:
add_to_cart,begin_checkout,purchase - Lead generation:
generate_lead,sign_up - Content:
share,search
4. Custom Events
For anything not covered above, you create custom events. Examples:
pricing_page_view— User visited your pricing pagedemo_request— User submitted a demo request formfeature_toggle— User interacted with a specific feature
How to Decide Which Event Type to Use
Here’s a practical decision framework:
- Is it already being tracked? Check your Events report. If the interaction shows up already (like page_view or scroll), you’re done — it’s an automatically collected or enhanced measurement event.
- Is there a recommended event name? Check Google’s recommended events list. If your interaction matches one (like
sign_uporpurchase), use that name exactly. - None of the above? Create a custom event. Use lowercase with underscores:
newsletter_signup, notNewsletterSignup.
⚠️ Common Mistake: Don’t create custom events that duplicate recommended events. If you create user_registered instead of using the recommended sign_up, you’ll lose access to pre-built reports and audiences that GA4 automatically generates for recommended events.
Event Parameters: Adding Context to Events
Every event can carry additional data through parameters. Think of parameters as extra details about what happened.
For example, the purchase event might include:
transaction_id: “T-12345”value: 59.99currency: “USD”items: [array of products]
GA4 automatically collects some parameters for every event (like page_location and page_title). But if you add custom parameters, you need to take one extra step to make them visible in reports.
Registering Custom Dimensions and Metrics
This is the step most people miss. Custom parameters are collected by GA4, but they won’t appear in your reports unless you register them as custom dimensions or metrics.
To register a custom parameter:
- Go to Admin → Custom definitions
- Click Create custom dimension
- Enter the dimension name (human-readable, like “Author Name”)
- Set the scope (Event or User)
- Enter the event parameter name (exact match, like
author_name) - Save
🚨 Critical Warning: Custom dimensions are NOT retroactive. They only start appearing in reports from the moment you register them. If you’ve been sending custom parameters for months but haven’t registered them, all that historical data is invisible in standard reports. (It is accessible via BigQuery export, however.)
Creating Custom Events via GTM
Let’s walk through a practical example: tracking when users click your “Request Demo” button.
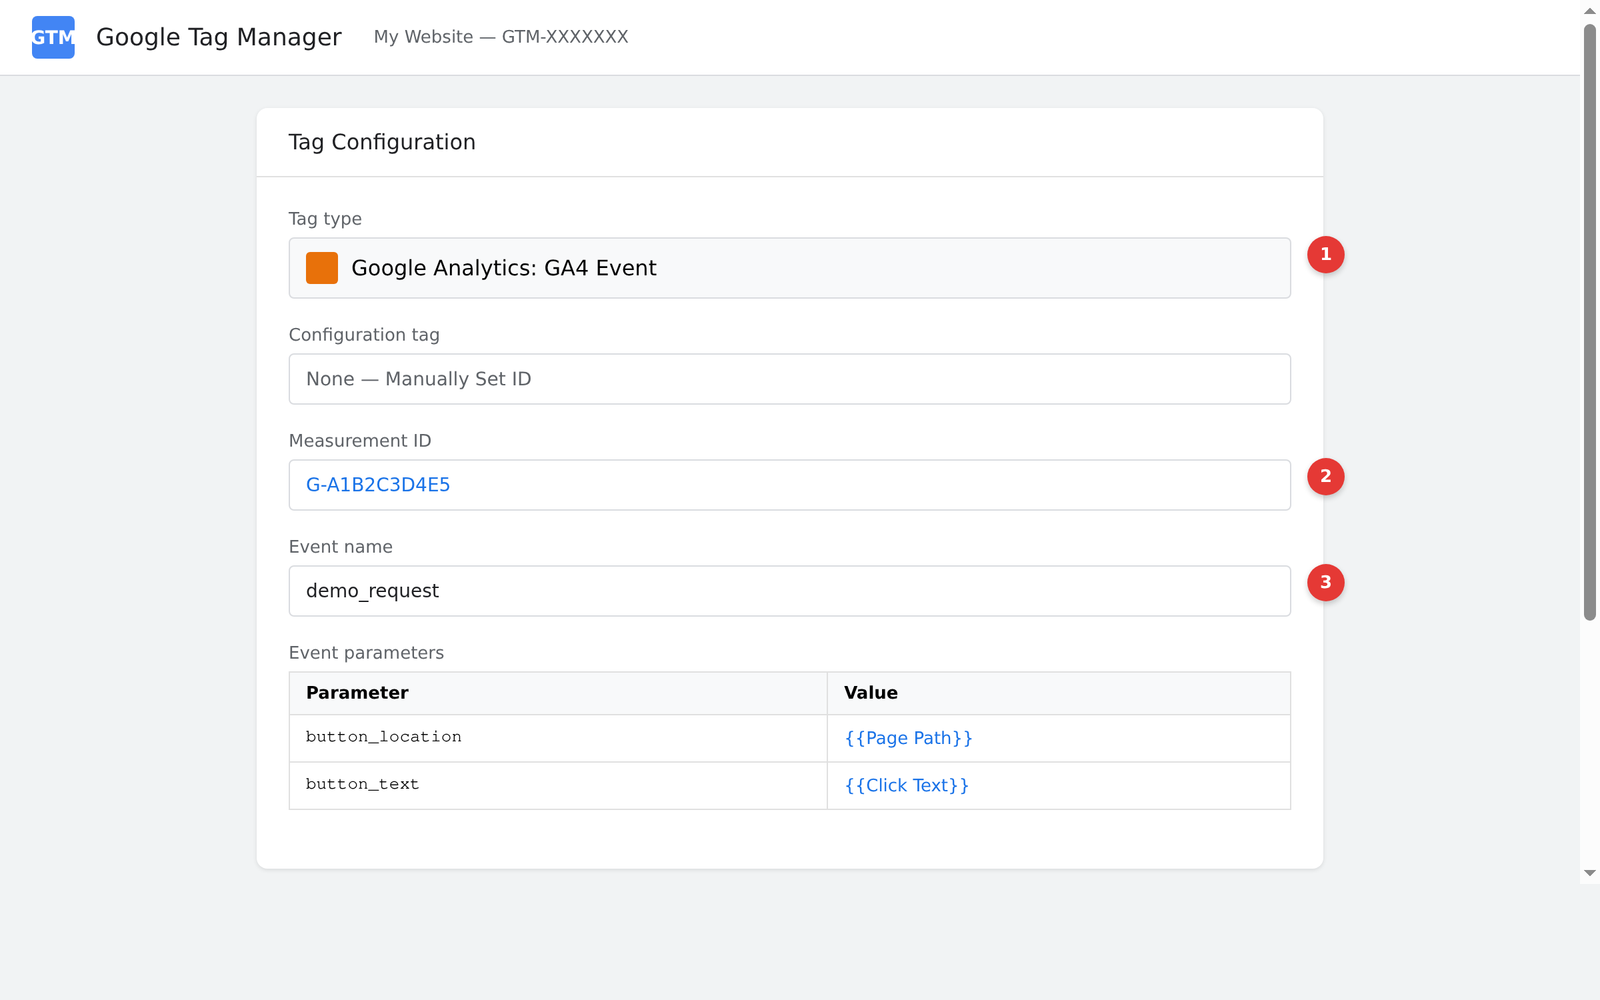
- Create a trigger in GTM: Click Trigger → New → Click – All Elements. Set it to fire on clicks where
Click Textequals “Request Demo” (or use a CSS selector if more precise targeting is needed). - Create a GA4 Event tag: Tags → New → Google Analytics: GA4 Event. Enter your Measurement ID, set Event Name to
demo_request. - Add event parameters (optional): Add a parameter like
button_locationwith value{{Page Path}}to know which page the click came from. - Preview and test: Use GTM’s Preview mode to verify the event fires correctly.
- Verify in DebugView: In GA4, go to Admin → DebugView to see events as they arrive in real time.
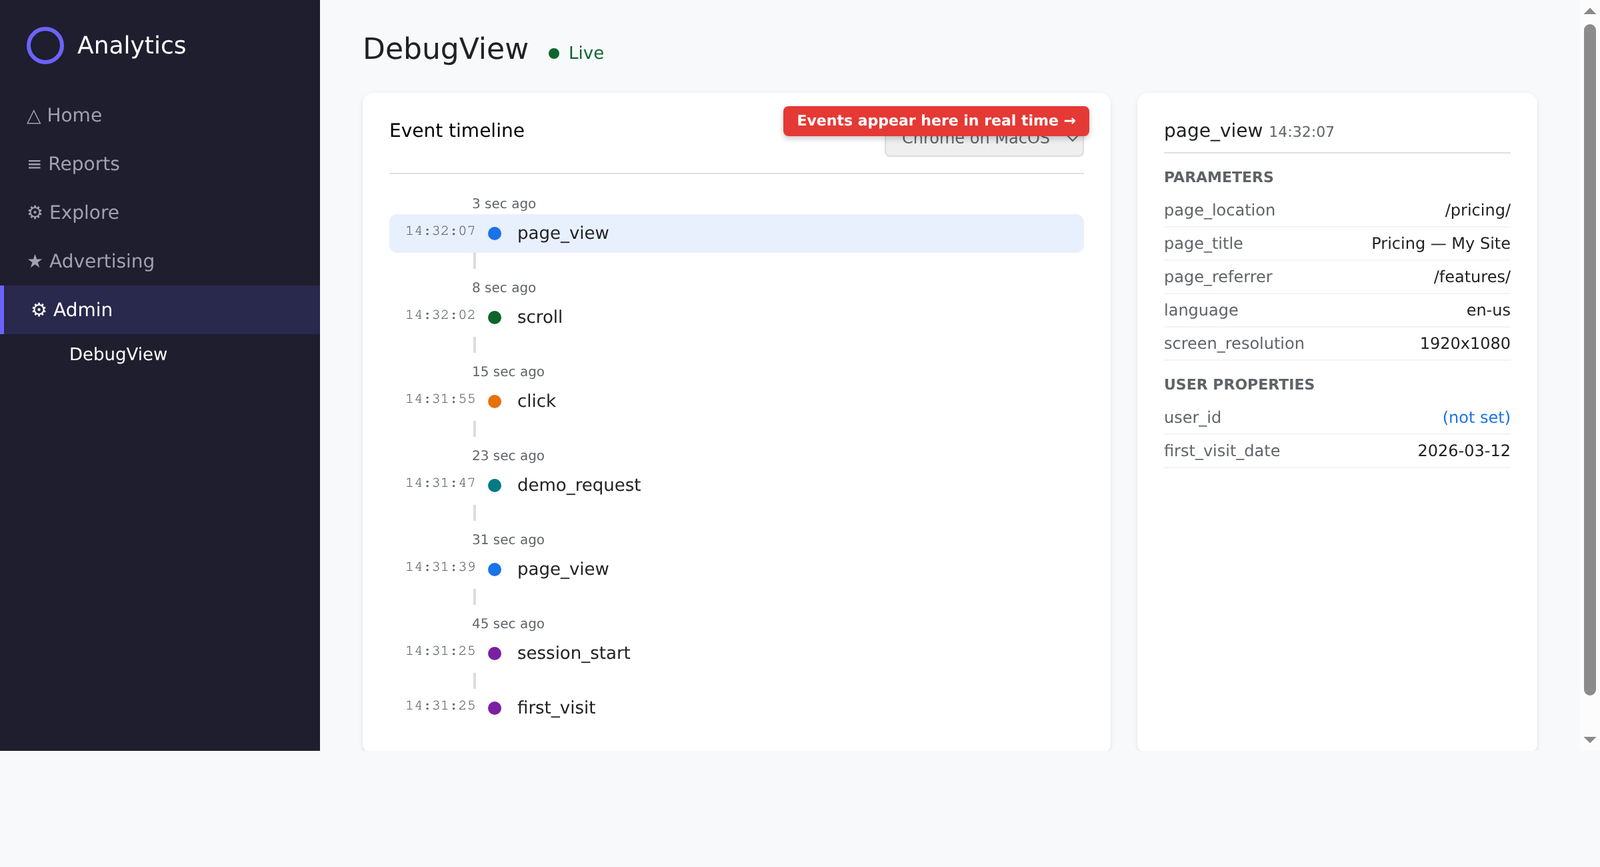
DebugView is your best friend during event implementation. It shows every event as it arrives, with all parameters, in a clear timeline. Enable debug mode by either using GTM Preview or installing the GA Debugger extension.
5. Key Events and Conversion Tracking
In early 2024, Google renamed “Conversions” to “Key Events” in GA4. The functionality is the same — it’s just a name change to align terminology with Google Ads (where “Conversions” means something slightly different).
A Key Event is simply an event that you’ve flagged as important to your business. When you mark an event as a Key Event, GA4 gives it special treatment in reports: it shows up in conversion columns, attribution reports, and audience building.
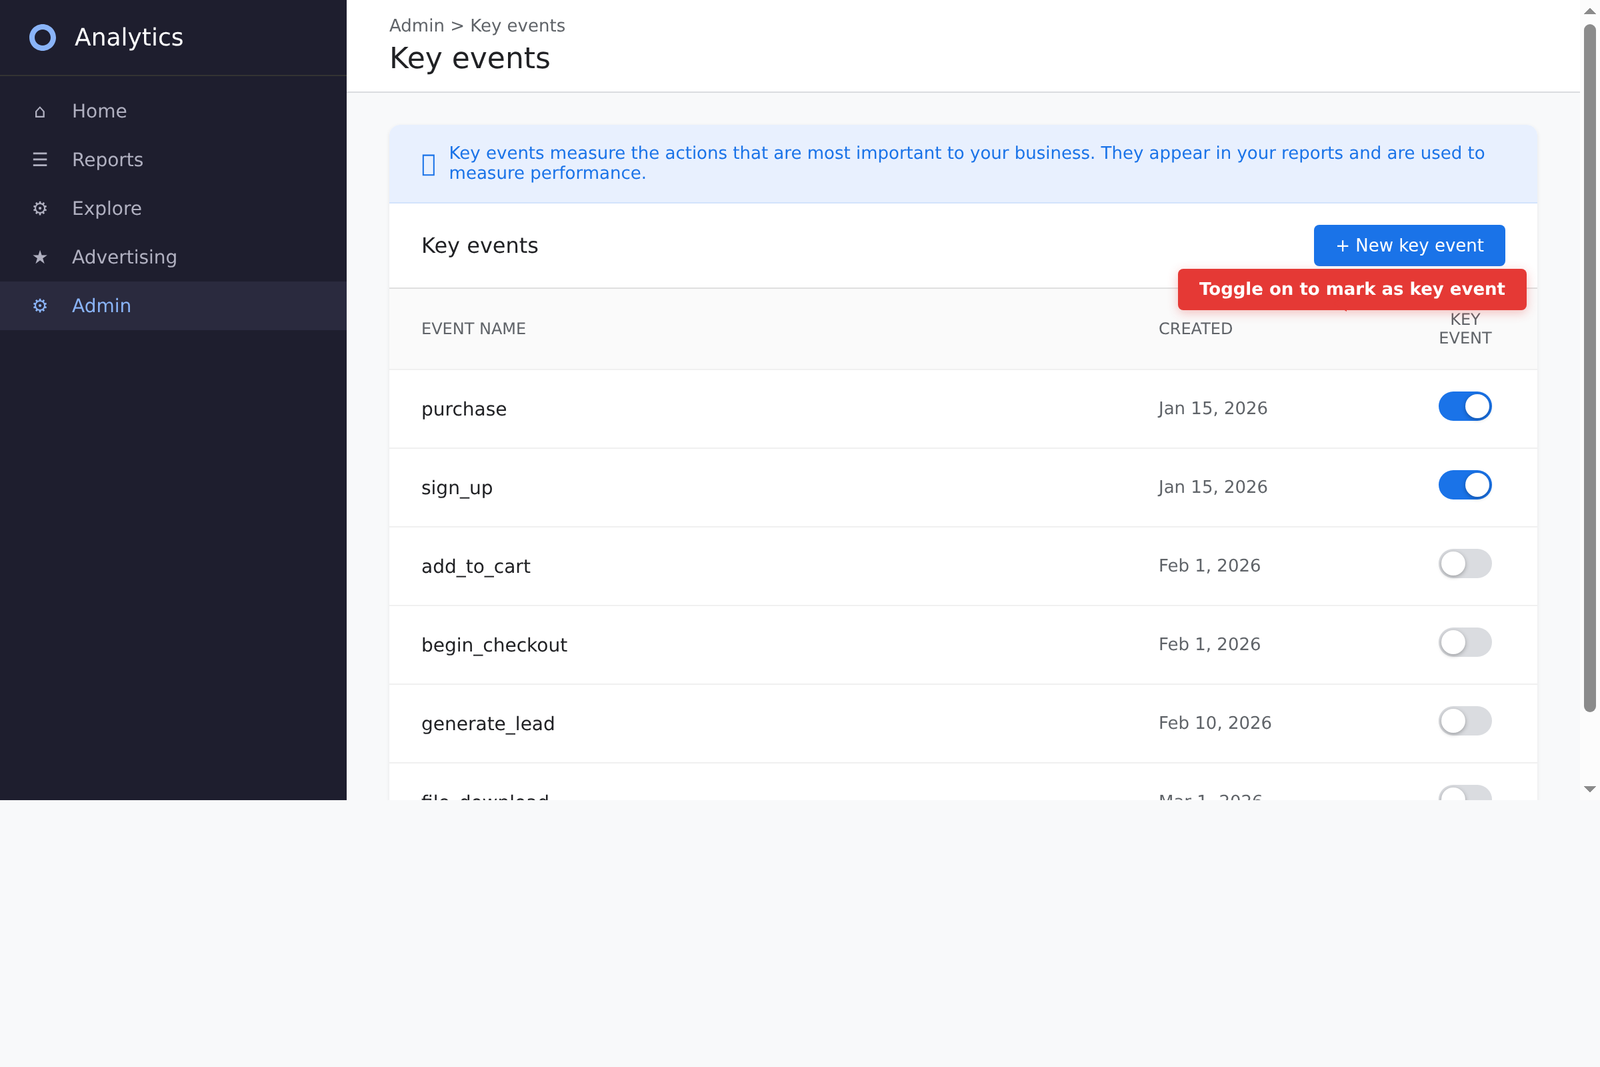
How to Set Up Key Events
There are two ways to create Key Events:
Method 1: Mark an Existing Event
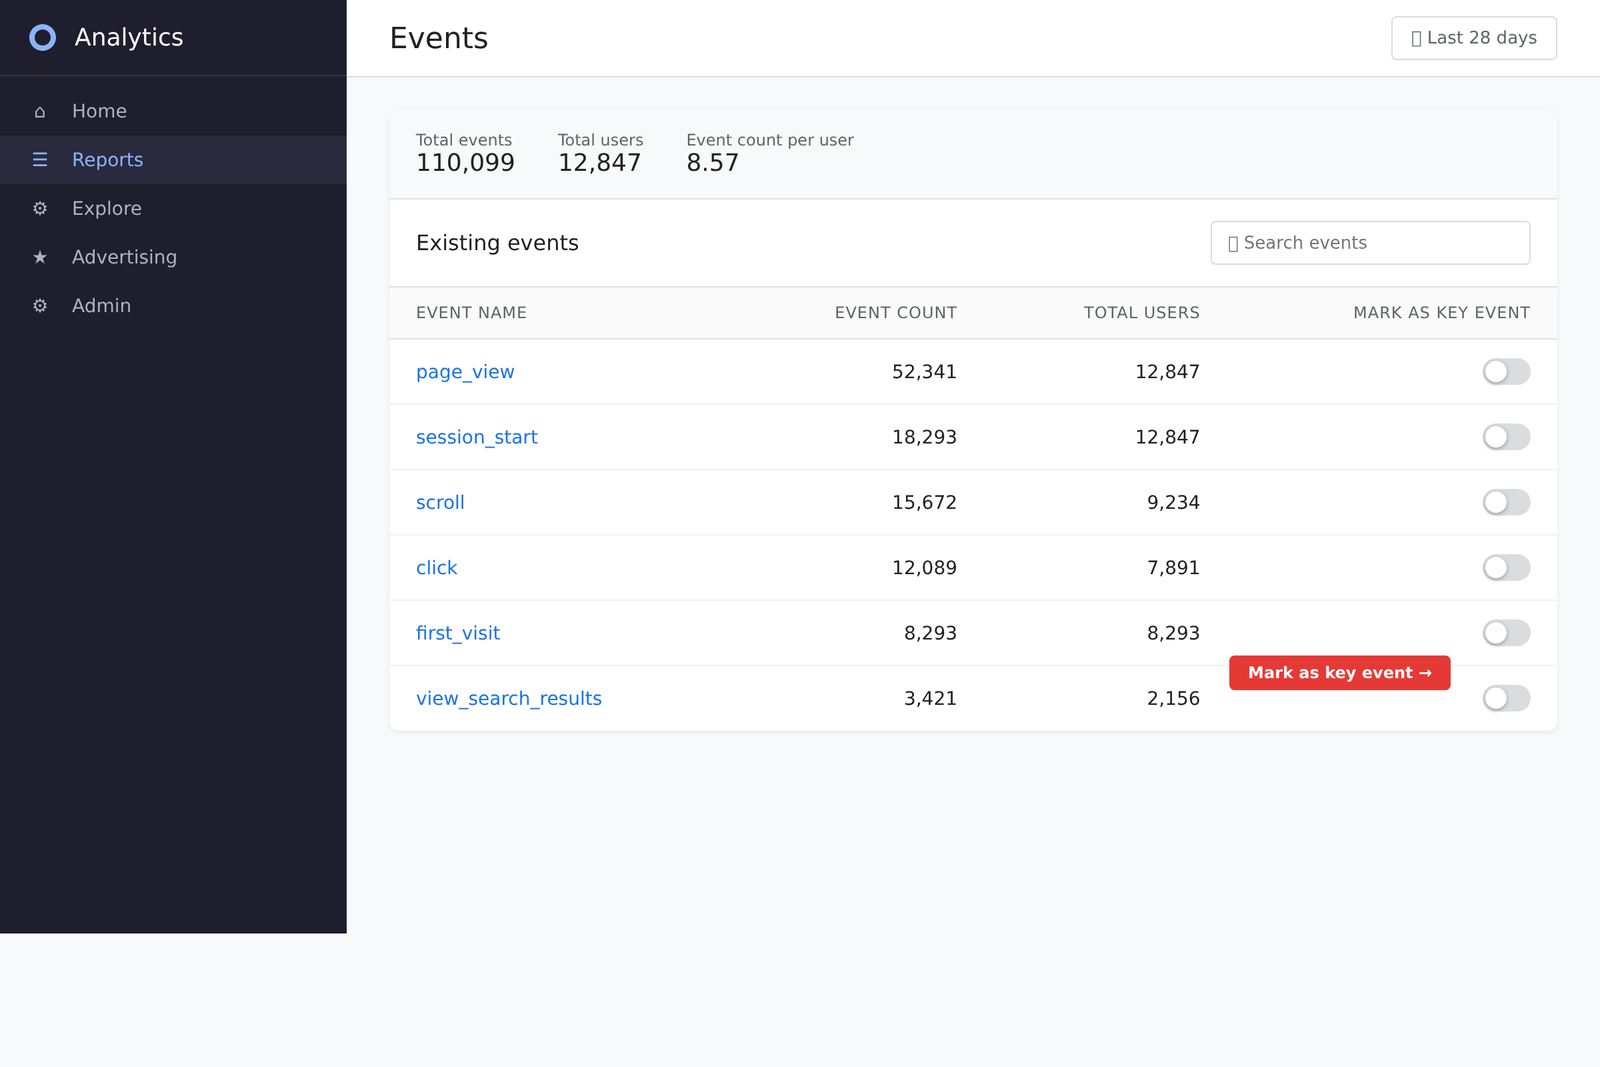
If the event is already being collected:
- Go to Admin → Events
- Find the event in the list
- Toggle the “Mark as key event” switch to ON
That’s it. From this point forward, GA4 will treat this event as a Key Event.
Method 2: Create a New Event from Existing Events
Sometimes you want a Key Event that’s more specific than a generic event. For example, you might want to track only page views of your “Thank You” page (which indicates a form submission):
- Go to Admin → Events → Create event
- Set the event name:
thank_you_page_view - Add conditions:
event_nameequalspage_viewANDpage_locationcontains/thank-you - Save, then mark the new event as a Key Event
What Should Be a Key Event?
Don’t mark every event as a Key Event — that dilutes their value. Focus on actions that directly relate to your business goals:
- E-commerce:
purchase,add_to_cart,begin_checkout - Lead generation:
generate_lead,sign_up, form submissions - Content sites: Newsletter signup, account creation, reaching a specific page
- SaaS: Trial started, feature activated, upgrade initiated
💡 Pro Tip: Start with 3-5 Key Events maximum. You can always add more later, but starting with too many makes your reports noisy. Ask yourself: “If this metric went to zero tomorrow, would someone in the business panic?” If yes, it’s a Key Event.
Key Events vs. Google Ads Conversions
This is where the naming gets confusing. In GA4, they’re called Key Events. When you link GA4 to Google Ads and import them, they’re called Conversions in Google Ads.
To send Key Events to Google Ads for campaign optimization:
- Link your GA4 property to Google Ads (Admin → Google Ads Links)
- In Google Ads, go to Goals → Conversions → Import
- Select your GA4 Key Events
Only import the Key Events you want Google Ads to optimize for — typically just purchase or generate_lead, not every Key Event you’ve set up.
6. Reports and Explorations
GA4 has two distinct reporting systems: Standard Reports for day-to-day monitoring and Explorations for deep analysis. Understanding when to use each saves you time and gives you better insights.
Standard Reports
Standard reports live under Reports in the left sidebar. They’re organized into collections:
Life Cycle Reports
- Acquisition: How users find your site (channels, sources, campaigns). The Traffic acquisition report is probably the one you’ll use most.
- Engagement: What users do on your site. The Pages and screens report shows your most visited pages. The Landing page report shows where users enter your site.
- Monetization: Revenue data (e-commerce purchases, ad revenue).
- Retention: How often users return. Shows new vs. returning user split and cohort analysis.
User Reports
- Demographics: Country, city, age, gender, interests.
- Tech: Browser, device category, screen resolution, operating system.
Each standard report can be customized. Click the pencil icon to add, remove, or reorder metrics and dimensions. You can also add comparison filters (e.g., compare mobile vs. desktop traffic) directly in the report.
Explorations: Where the Real Analysis Happens
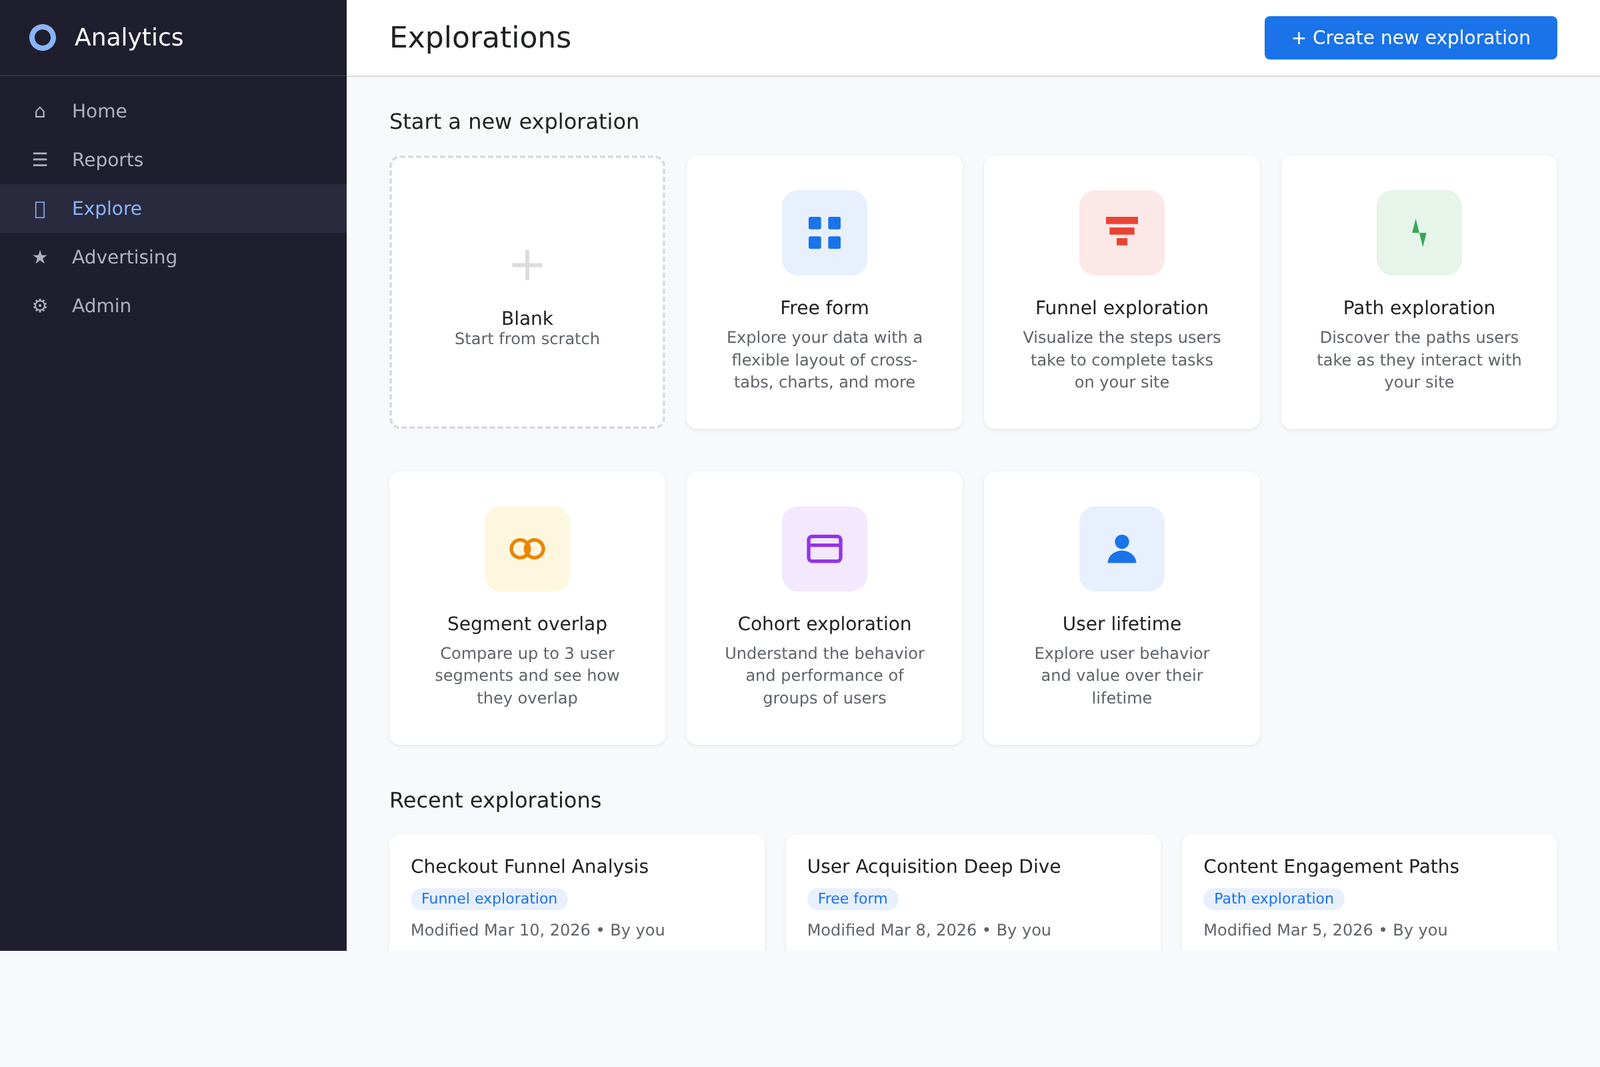
Explorations are GA4’s power tool. While standard reports give you quick answers, Explorations let you ask complex questions and build custom analyses. Think of them as a built-in data studio.
GA4 offers several Exploration templates:
Free-form Exploration
The most flexible option. Drag and drop dimensions and metrics to create custom tables, charts, and pivot tables. Use this when standard reports don’t have the exact data view you need.
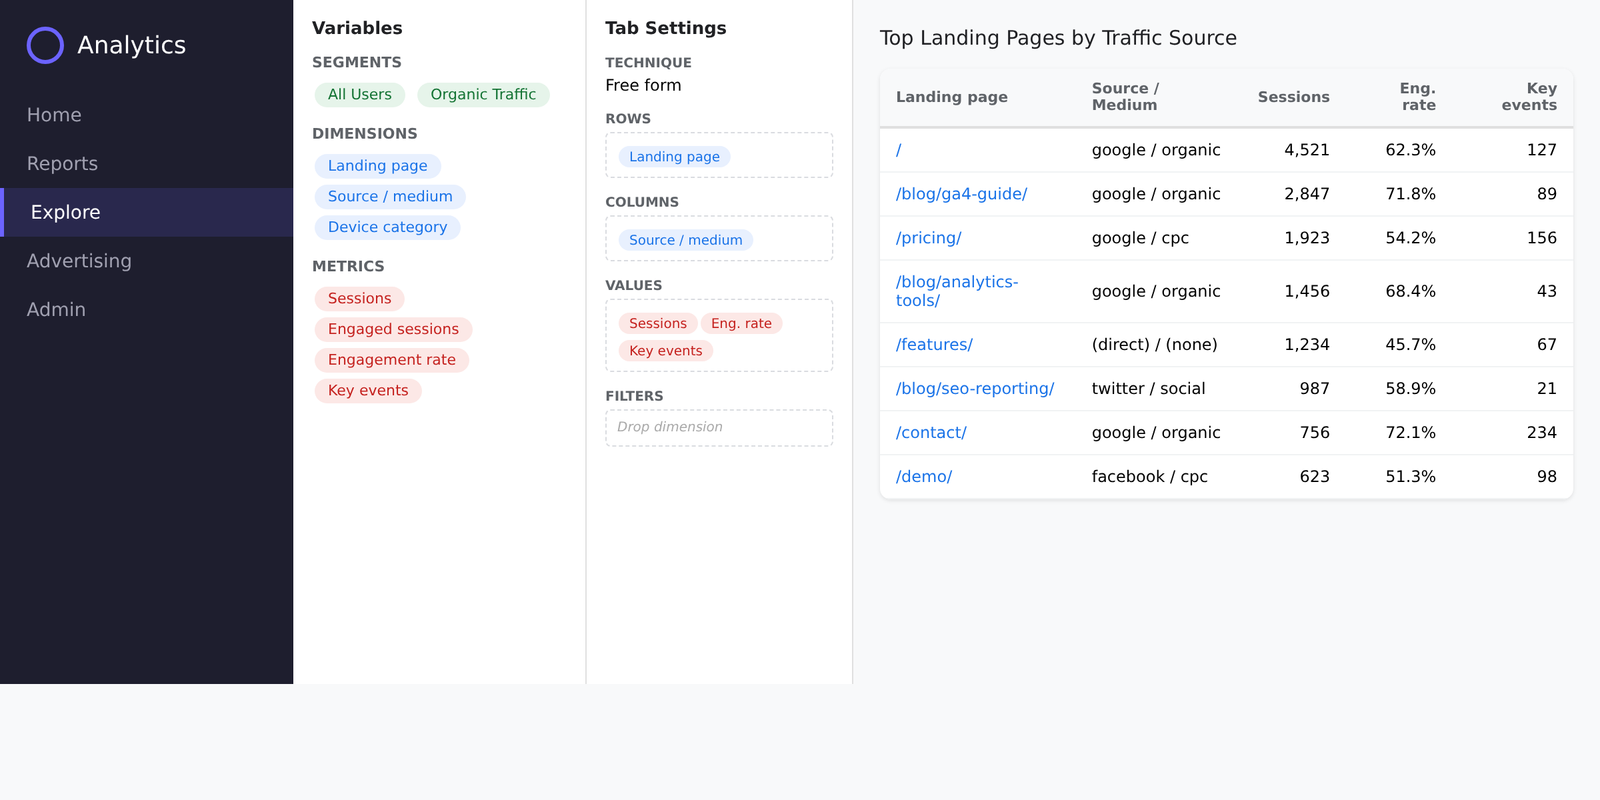
Example: “Show me the top landing pages by organic traffic, with engagement rate and conversions, segmented by device type.”
Funnel Exploration
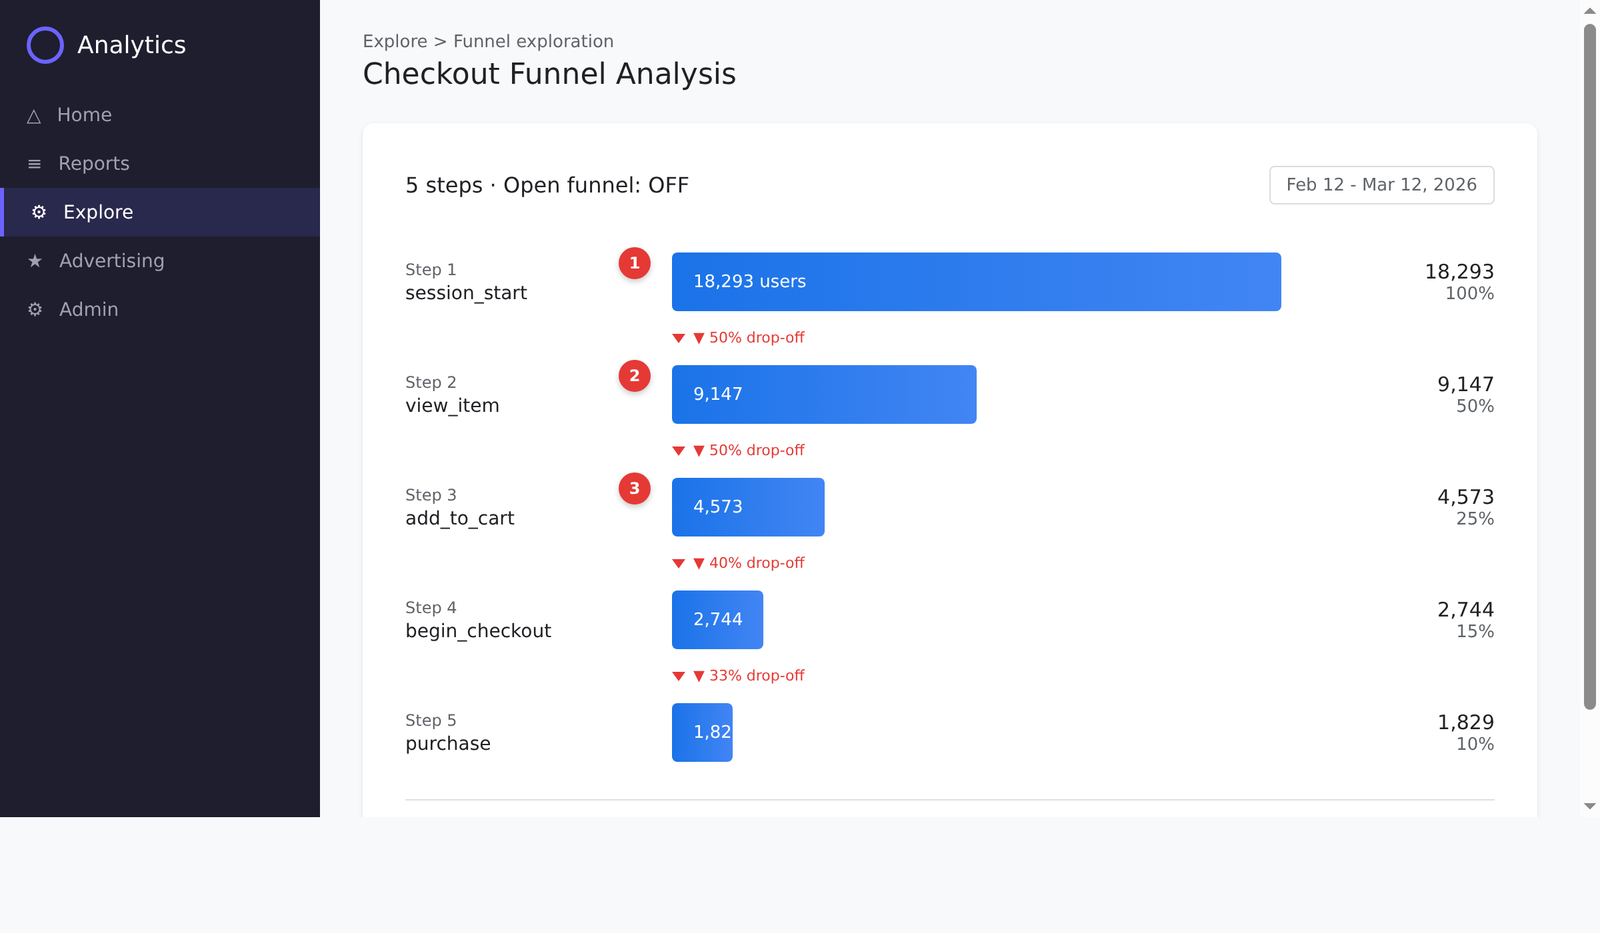
Visualize how users progress through a multi-step process. This is essential for understanding where users drop off.
A typical e-commerce funnel might look like:
session_start— 18,293 users (100%)view_item— 9,147 users (50%)add_to_cart— 4,573 users (25%)begin_checkout— 2,744 users (15%)purchase— 1,829 users (10%)
The funnel immediately reveals your biggest drop-off points. If 50% of users view products but only 25% add to cart, your product pages might need work. If 15% begin checkout but only 10% complete it, focus on the checkout experience.
💡 Pro Tip: Toggle on “Make open funnel” to see users who entered at any step, not just the first. This reveals users who skip steps (e.g., going directly to checkout from a saved cart link).
Path Exploration
Shows the actual sequence of pages or events users follow. Start from a specific page (like your homepage) and see where users go next, then where they go after that. This is invaluable for understanding natural user behavior vs. what you designed.
Segment Overlap
Visually compare up to 3 user segments. For example: how many users are both “mobile users” AND “made a purchase” AND “came from Google”? The Venn diagram makes overlaps instantly clear.
Building Your First Exploration: Practical Walkthrough
Let’s build a useful exploration: Top Landing Pages by Source with Engagement Metrics.
- Go to Explore and click Blank
- In the Variables panel (left), click the + next to Dimensions and add:
Landing page + query string,Session source / medium - Click + next to Metrics and add:
Sessions,Engaged sessions,Engagement rate,Key events - In the Tab Settings panel (right), drag Landing page to Rows, Session source / medium to Columns (or add as a second Row dimension)
- Drag all four metrics to Values
- Set Rows to show: 25 (or more)
You now have a report showing exactly which pages bring in the most engaged traffic from each source — something the standard reports don’t show in a single view.
7. Essential Integrations
GA4 becomes significantly more powerful when connected to other Google tools. Here are the integrations worth setting up immediately.
Google Search Console
This integration brings your organic search performance data (impressions, clicks, average position, CTR) directly into GA4. It’s one of the most valuable free integrations available.
To set up:
- Go to Admin → Product links → Search Console Links
- Click Link
- Select your Search Console property (you must have admin access to both)
- Choose the web data stream to associate
- Submit
Once linked, you’ll find Search Console data under Reports → Search Console (you may need to add it to your report navigation via the Library).
The Google organic search queries report shows you which search terms drive traffic — and when combined with GA4’s engagement metrics, you can see not just which queries bring visitors, but which queries bring visitors who actually engage.
Google Ads
If you’re running Google Ads campaigns, linking to GA4 unlocks two critical features:
- Import conversions: Use GA4 Key Events as Google Ads conversion goals, giving the bidding algorithm better data to optimize against.
- Create audiences: Build remarketing audiences in GA4 based on behavior (e.g., “users who visited the pricing page but didn’t sign up”) and use them directly in Google Ads campaigns.
To link: Admin → Product links → Google Ads Links → Link.
BigQuery Export
This is GA4’s most underrated feature — and it’s free. BigQuery export sends your raw, unsampled event data to Google BigQuery, where you can run SQL queries against it.
Why you should set this up even if you don’t plan to use it right now:
- Data retention: GA4’s free tier only retains detailed data for 14 months. BigQuery retains it indefinitely (within your Google Cloud storage limits).
- No sampling: Standard GA4 reports apply data thresholds and sampling to large datasets. BigQuery data is complete and unsampled.
- Future flexibility: When you’re ready for advanced analysis, the data will be there waiting for you.
To enable: Admin → Product links → BigQuery Links → Link. You’ll need a Google Cloud project (a free tier project works fine for most sites).
⚠️ Cost Warning: BigQuery storage and queries have costs, but for small-to-medium websites (under 1M events/month), you’ll likely stay within Google Cloud’s free tier. The daily export tables cost pennies to store and query.
Looker Studio (formerly Data Studio)
GA4’s built-in reports are useful, but for client reporting, team dashboards, or combining data from multiple sources, Looker Studio is the way to go. It connects natively to GA4 and lets you build polished, shareable dashboards.
No setup needed — just go to lookerstudio.google.com, create a new report, and select GA4 as a data source.
8. Common Mistakes and How to Fix Them
After working with GA4 across many sites, I see the same mistakes repeatedly. Here’s what to watch for and how to fix each one.
Mistake #1: Not Changing the Default Data Retention
By default, GA4 retains event data for 2 months. This means Explorations can only query the last 2 months of detailed data. Standard reports use aggregated data and aren’t affected, but this severely limits your custom analysis.
Fix: Go to Admin → Data Settings → Data Retention. Change it to 14 months (the maximum for free accounts). Do this immediately — the setting is not retroactive.
Mistake #2: Creating Too Many Custom Events
There’s a limit of 500 distinctly named events per property. That sounds like a lot, but event names like click_button_hero_homepage_v2 eat through your quota fast.
Fix: Use parameters instead of unique event names. Instead of click_hero_button and click_footer_button, use a single button_click event with a button_location parameter. This keeps your event count low and your data flexible.
Mistake #3: Not Filtering Internal Traffic
Your team’s visits skew your data. GA4 doesn’t filter internal traffic by default.
Fix:
- Go to Admin → Data Streams → [your stream] → Configure tag settings → Define internal traffic
- Add your office IP address(es)
- Go to Admin → Data Settings → Data Filters
- Set the Internal Traffic filter to Active (it starts in “Testing” mode)
⚠️ Common Mistake: Don’t forget to activate the filter! Many people define the internal traffic rule but leave the data filter in “Testing” mode, which doesn’t actually filter anything from your reports.
Mistake #4: Ignoring Cross-Domain Tracking
If your user journey spans multiple domains (e.g., your marketing site is on example.com but checkout is on shop.example.com), GA4 will count the domain change as a new session by default.
Fix: Go to Admin → Data Streams → Configure tag settings → Configure your domains. Add all domains that are part of the same user journey. GA4 will pass the client ID between domains, maintaining the session.
Mistake #5: Not Setting Up Consent Mode
If your website has visitors from the EU (and most do), you need to comply with GDPR and ePrivacy regulations. Without consent mode, you either lose all analytics data from users who don’t consent, or you’re potentially violating privacy laws.
Fix: Implement Google Consent Mode v2. When a user declines cookies, GA4 switches to cookieless pings that model conversions without identifying individual users. You get estimated data instead of nothing. Most consent management platforms (Cookiebot, OneTrust, CookieYes) support Consent Mode natively.
For more details, check our GDPR for Web Analytics guide.
Mistake #6: Forgetting to Register Custom Dimensions
As mentioned in the Events section, custom parameters don’t appear in reports until you register them as custom dimensions. This is the #1 “why can’t I see my data?” question in GA4.
Fix: Every time you create a custom event with parameters, immediately go to Admin → Custom definitions and register each parameter as a dimension or metric.
Mistake #7: Using the Wrong Attribution Model
GA4 defaults to data-driven attribution for Key Events. This uses machine learning to distribute credit across touchpoints. For sites with low traffic or few conversions, this model may not have enough data to work well.
Fix: If you have fewer than ~300 conversions per month, consider switching to last-click attribution for simpler, more transparent reporting. Go to Admin → Attribution settings.
Frequently Asked Questions
Is Google Analytics 4 free?
Yes. The standard version of GA4 is completely free and includes features that were previously paid-only in Universal Analytics (like BigQuery export and up to 30 Key Events). Google also offers GA4 360, a paid enterprise version with higher data limits, SLAs, and advanced features — but the free version is sufficient for the vast majority of websites.
How long does it take for data to appear in GA4?
Real-time data appears within seconds. Standard reports are typically updated within 24-48 hours, though during busy periods this can stretch to 72 hours. If you need to verify that data is being collected right now, always use the Realtime report or DebugView.
Can I use GA4 and Universal Analytics at the same time?
Universal Analytics stopped processing data on July 1, 2023 (October 1, 2023 for 360 properties). It is no longer possible to collect new data in UA. If you haven’t switched to GA4 yet, your only option now is GA4.
What’s the difference between “Users” and “Active Users” in GA4?
“Active Users” is the primary metric in GA4 and what you see when a report simply says “Users.” It counts users who had an engaged session or triggered a key event within your date range. “Total Users” counts all users who logged any event, regardless of engagement. In most reports, “Users” = “Active Users.”
How do I track form submissions in GA4?
There are several approaches depending on your form setup:
- Thank you page redirect: Create a Key Event based on page_view of your thank-you page URL
- GTM form submission trigger: Use GTM’s built-in Form Submission trigger
- Custom event via dataLayer: Push a custom event when the form is submitted successfully
The thank-you page method is the simplest and most reliable if your form redirects after submission.
Why is my bounce rate so different in GA4 compared to UA?
GA4 defines bounce rate as the inverse of engagement rate. A session is “engaged” if it lasted 10+ seconds, had 2+ page views, or triggered a key event. This means GA4’s bounce rate is typically 20-40% lower than UA’s, which only counted single-page sessions as bounces regardless of time spent. GA4’s definition is more meaningful — a user who reads your article for 5 minutes but visits only one page was a “bounce” in UA but an “engaged session” in GA4.
How do I set up e-commerce tracking in GA4?
E-commerce tracking requires pushing structured data to the dataLayer for each step of the purchase flow (view_item, add_to_cart, begin_checkout, purchase). The implementation depends on your e-commerce platform — most major platforms (Shopify, WooCommerce, Magento) have plugins or built-in integrations that handle this. For custom implementations, refer to Google’s e-commerce developer guide.
Can GA4 track users across devices?
Yes, through two mechanisms: User ID (you assign a consistent ID when users log in across devices) and Google Signals (uses Google account data for signed-in users). Enable Google Signals under Admin → Data Settings → Data Collection. Note that Google Signals can trigger data thresholds in reports, which hide rows to protect user privacy.
What’s Next?
GA4 is a powerful platform, and this guide covers the fundamentals you need to get real value from it. Here’s what I’d suggest as your next steps:
- This week: Set up your GA4 property, install the tracking code, and change data retention to 14 months.
- Next week: Define 3-5 Key Events that map to your business goals. Set up internal traffic filtering.
- This month: Build your first Exploration. Connect Search Console. Set up BigQuery export.
- Ongoing: Review your data weekly. Look for patterns in engagement, not just traffic numbers. The best analytics practice is consistent attention, not occasional deep dives.
The most important thing isn’t mastering every feature — it’s setting up your tracking correctly from the start so the data is there when you need it. Get the foundations right, and everything else follows.
If you’re wondering which analytics tools might complement (or replace) GA4 for your specific needs, check out our guide on choosing the right web analytics tool. And if privacy compliance is a concern, our GDPR compliance guide covers exactly what you need to know.
Ethan Lewis is an SEO strategist and web analytics consultant with over 8 years of experience helping businesses turn data into growth. He specializes in privacy-compliant analytics, technical SEO, and conversion optimization. At Statlyzer, Ethan writes in-depth guides that make complex analytics topics accessible to marketers and website owners.